Vivaldi 天线
日期:2012-06-19
| Vivaldi Antenna |
|
Model Geometry printout The "Build" tool performs MicroStripes geometry entry and problem setup. This tool is based on the industry standard ACIS kernel and offers all the necessary primitives to create very complex models. For the antipodal Vivaldi antenna, the geometry input took less than 10 minutes as all the primitives needed to define the geometry were available. The top ground plane was defined first as a set of points following the outline of the copper etching using line and ellipse primitives. This edge is then turned into a surface, which is given a thickness to represent a solid object. This object is then copied and translated by the total thickness of the substrate to become the bottom ground plane. The centre conductor was also generated from a rotated copy of the ground plane, which has in turn been translated by half the total thickness of the dielectric. The next step is assigning material properties for the different entities of the model. The model contains three solid objects.
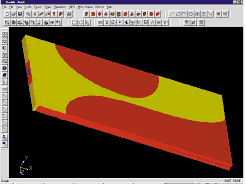
Figure 2: 3D representation of antenna showing the dielectric extent in red. The dielectric has a
The electrical properties of metals, dielectrics and microwave substrates are contained in a database, which is made accessible to the user through the build tool. The wanted metal or dielectric is easily attached to a geometrical entity via a mouse click. In this case both materials copper and the Rogers Duroid 5870 are in the database. The Duroid material has a permittivity of 2.32 and also a loss tangent defined at 10GHz. The loss tangent has been included in our model.
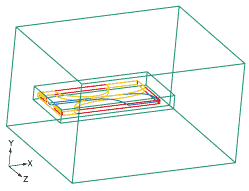
Figure 3: Shows the Vivaldi antenna
The "Build" model requests the user for the upper frequency limit of the model to compute the maximum grid size. In this case an upper limit of 18GHz is chosen giving a maximum grid size of 1.6 mm in air. The meshing of the model is performed automatically by the auto-mesh function to ensure that: The correct grid size is chosen in-side the dielectrics.The major features and planes are snapped to the grid so their size is correctly mapped in to the discretised model.
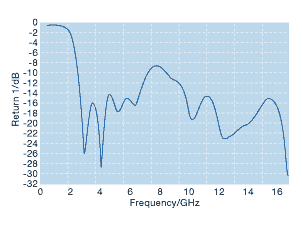
Figure 4: S11 response of Vivaldi antenna (a) referred to 43 line impedance and (b) normalised to 50 impedance
The use of multi-gridding in the auto-mesh function allows selective gridding of the model by allowing areas where detail requires to be meshed more finely than other parts of the model. This ability results in optimal grid size distribution and gives a substantial reduction in the problem size. The model symmetry along the plane y=0 mm is exploited to reduce the problem size by half and is enforced by a magnetic wall boundary condition at this plane. The excitation of the model is performed using the "Ports" module, which attaches a TEM port at the input of the device. Other ports are also available to excite different microwave devices such as coaxial lines and waveguides. The last step to perform is to write out a discretised file to input the solver. The total work space defining the geometry without symmetry is 152 x 90 x 120mm2. In our model half of this was eliminated by symmetry.
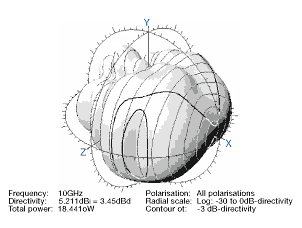
Figure 5(a): Three-dimensional radiation
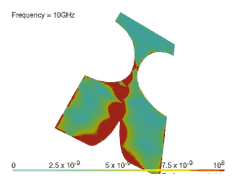
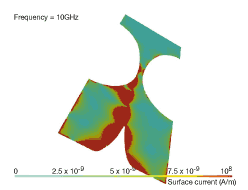
Figure 5(b) shows the field plot at 10GHz
Figure 4(a) shows the return loss (S11) response of the antenna referred to the line impedance at the input port of the model, which is 43, and Figure 4(b) shows the return loss when the port impedance is normalised to 50. Pattern data output at 10GHz The radiation patterns were computed for the Vivaldi antenna at 10GHz, and are shown in full in Figure 5(a). The bold line represents the outline of the 3dB beam. The fine lines mark the 10° intervals from boresight. The radial scale covers 30dB.
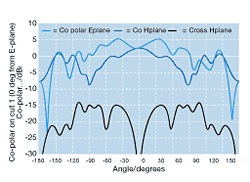
Figure 6(a): Principal plane cuts for Vivaldi
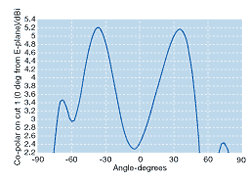
Figure 6(b): Expanded co-polar E plane cut,
Figure 6(c): Expanded co-polar H plane cut giving a 3dB beamwidth of 110° Figure 6(a) shows the principal plane cuts for the Vivaldi antenna at 10GHz. For clarity, the 3dB beamwidth has been evaluated from the expanded plots for both E and H plane cuts, shown in Figures 6(b) and (c) respectively. The E plane cut shows two distinct peaks disposed on either side of boresight. The total 3dB beamwidth given by this cut is 130°.
The definition of the 3dB beamwidth is not clear, because the beam shape does not exhibit a main lobe on boresight. If we assume that the beam peak is located off boresight and off the H plane cut, a level 3dB down from the peak intersects this pattern at 2.2dBi. The beamwidth would then be ±8.5°. Note that should the phase distribution across the aperture at this frequency changes slightly, this might cause the first shoulder in Hardware information The computer used is a Hewlett Packard Omnibook 6000 laptop, with a 650MHz Pentium III processor, a single CPU, and 128Mb of RAM. The operating system was Windows NT, Service Pack 6. Software information The software used was MicroStripes Version 5.5. The RAM required was 50Mb (negligible disk space). The number of cells was 400,000. The time to compute the response over the 500MHz to 18GHz is 42 minutes. When the band is reduced to 500MHz to 10GHz, the run time is only 15 minutes. |


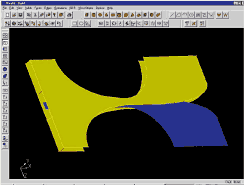 Figure 1: shows the 3D metallic entities in the of the Vivaldi antenna modelled by MicroStripes.

 沪公网安备 31010602003953号